From population to seats
Trace the census from 1790 to 2020 and see how population counts shape representation in the House.
 Dynamic HistoryTimeline & Maps for Students
Dynamic History / Civics / Grades 9–12
How does a count of people become political power?
Six guided investigations help students trace census numbers into seats, district lines, legislatures, and presidential electors.
6 lessons available · Guided map investigations
The story behind the map
The census counts people. Apportionment assigns House seats. States draw districts. One address sits inside several layers of government. This series follows that chain step by step, with maps that make each change visible.
Students also compare the two houses of Congress, investigate where Electoral College votes come from, and see how a new census can change seats and lines. The lessons keep the arithmetic connected to places and the people they represent.
See the series in action
Preview how census and election maps become evidence students can question.
Series preview · Elections & Representation
What students investigate
Trace the census from 1790 to 2020 and see how population counts shape representation in the House.
Compare district maps and the layers of representation that connect one place to multiple elected officials.
Investigate the House, Senate, Electoral College, and the changes that follow each census.
The series
All six mapped civics investigations are available. The first lesson is free to explore.
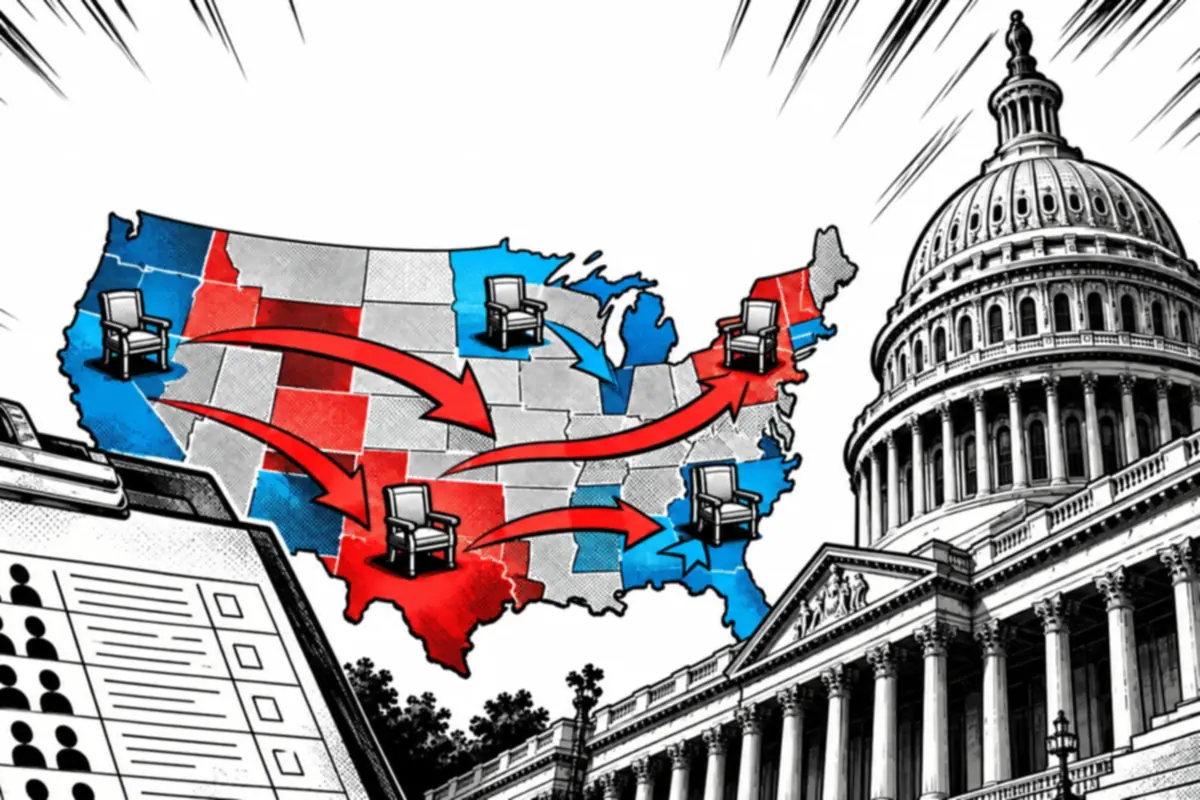
Six mapped stops from the first census in 1790 to the 2020 count.
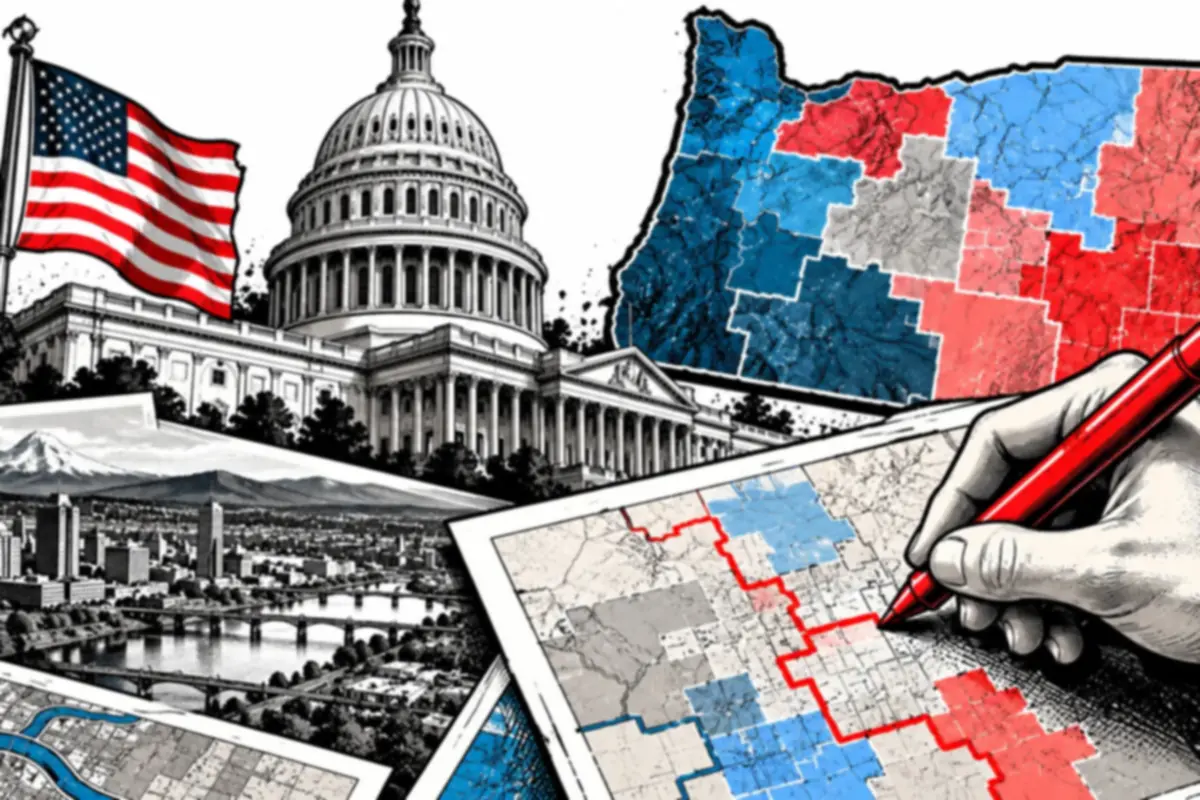
Six mapped stops from Oregon's sixth House seat to the six districts drawn for it.
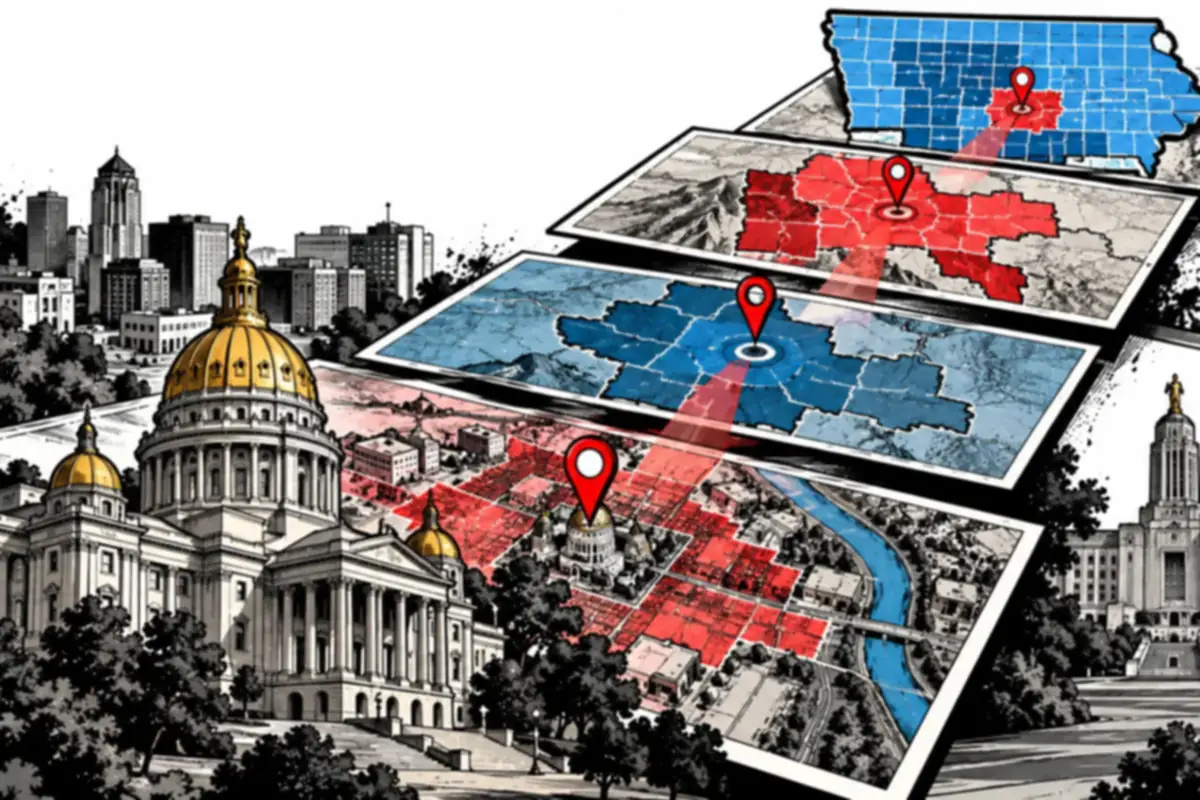
Six mapped stops outward from the Iowa State Capitol, one layer of representation at a time, then across to Nebraska's one-house legislature.
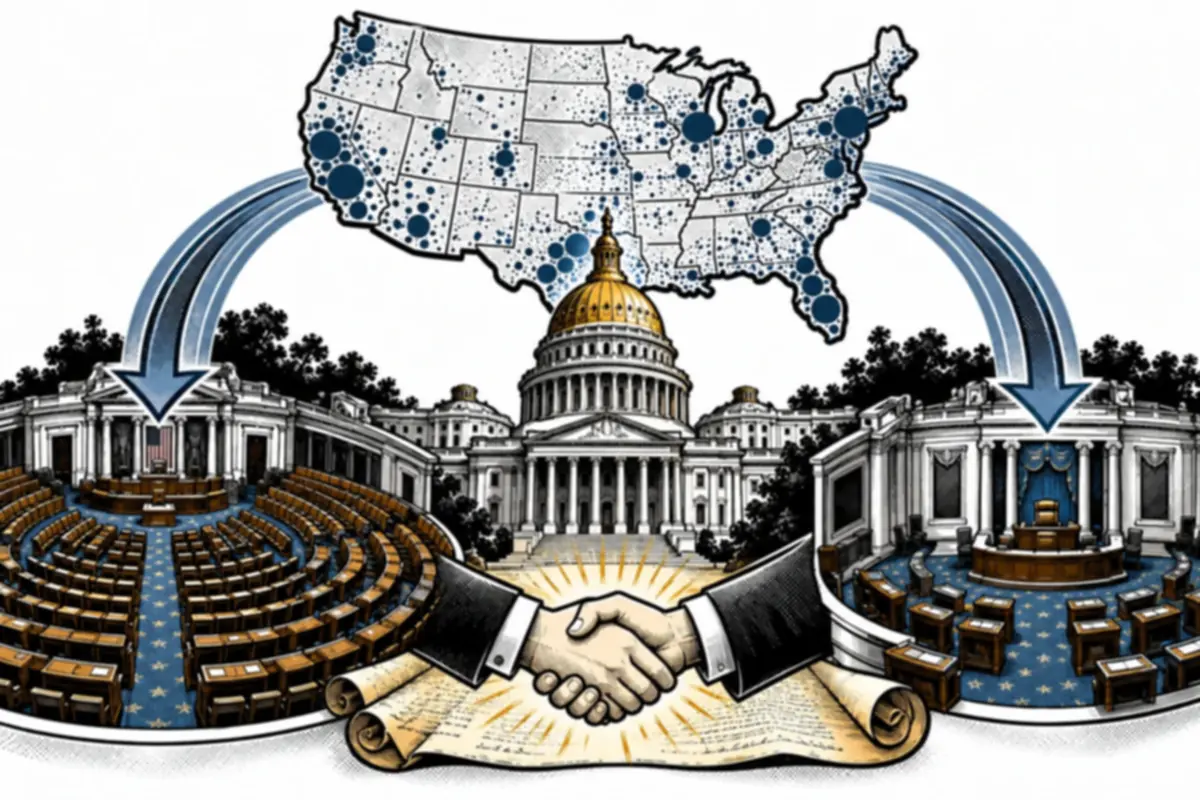
Six mapped stops from the Articles of Confederation to the 17th Amendment.

Six mapped stops from Article II to the 538 electors of 2024 and 2028.
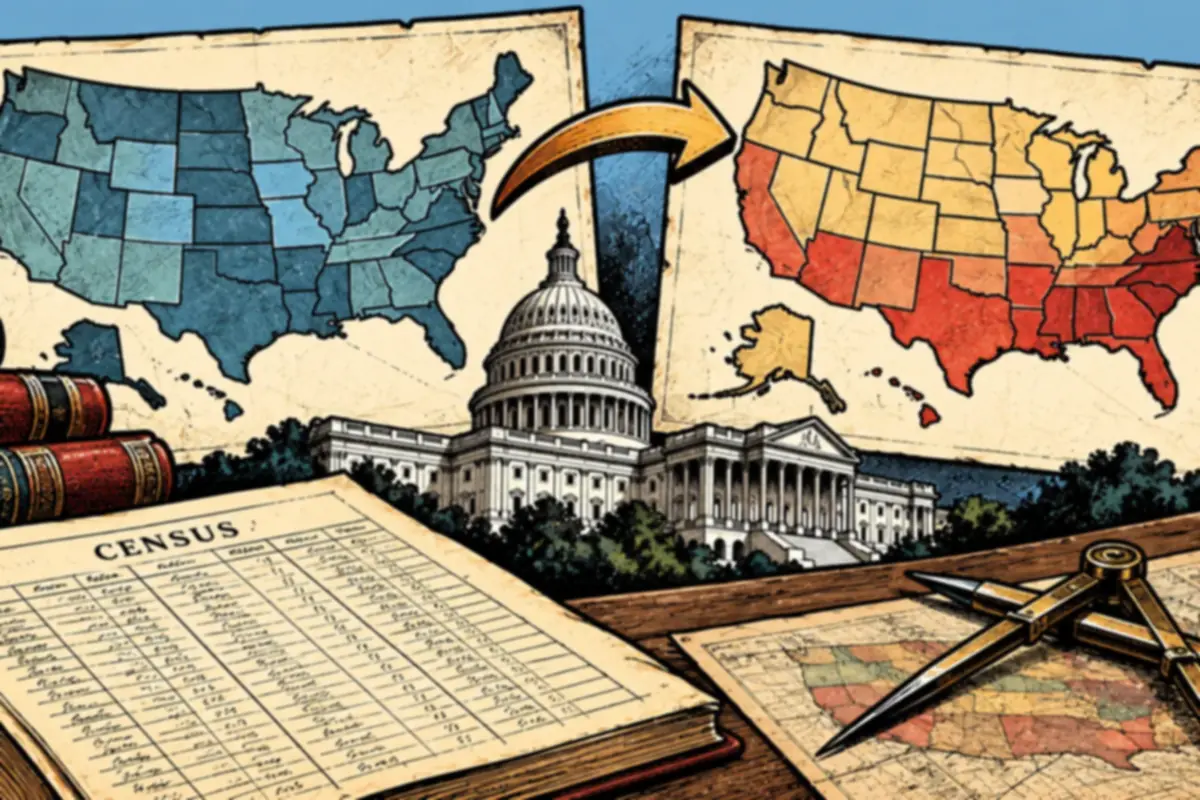
Six mapped stops following Montana, West Virginia and Iowa from the 2010 count to the 2020 count.
For teachers and curious students
Start with the free population and representation lesson, then follow the count into districts, Congress, and presidential elections.
Begin with the free lesson